How To Calculate NDVI Pixel Values

Sometimes there is a need of the calculation of Normalised Difference Vegetation Index. Or, simply speaking, it is well-known as the task to calculate NDVI pixel values of a particular location. Sure, it is not always an easy and straightforward task. Indeed, in such cases, it is important to pay attention not only on the pixels that fall within the geodetic chain. What else is important? We’ll try to consider other key aspects of calculation.

What is NDVI mapping?
Firstly, we need to understand what is Normalised Difference Vegetation Index (NDVI) map to clarify how to work with it and get the most data. Also, many researchers call this type of maps as “NDVI greenness maps”.
In fact, NDVI is a simple graphical indicator. This index indicates the greenness of the biomass. Researchers and practitioners use it to analyze remote sensing measurements. Also it helps to assess whether the target contains live green vegetation or not.
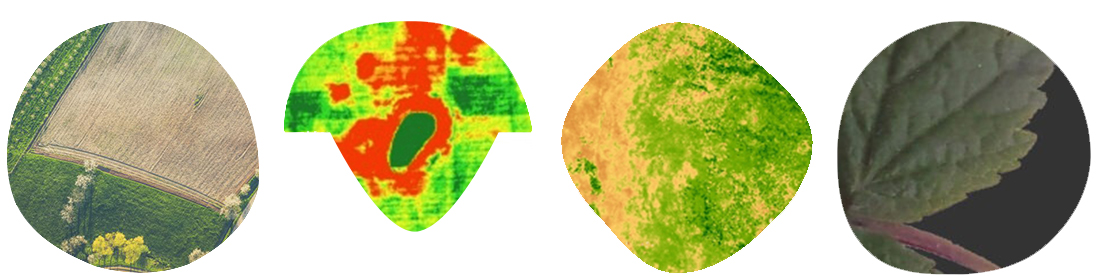
NDVI maps are the collection of data gathered by satellite sensors that measure wavelengths of light absorbed and reflected by green plants. In this case, certain pigments in plant leaves strongly absorb wavelengths of visible (red) light. The leaves themselves strongly reflect wavelengths of near-infrared light, which is invisible to human eyes. As long as a plant canopy changes from early spring growth to late-season maturity and senescence, these reflectance properties also change.
How is NDVI value calculated?
To emphasize how to calculate NDVI, it is important to remember the basics of this index.
Even though Normalised Difference Vegetation Index is not a physical property of the vegetation cover, its very simple formulation NDVI = (REF_nir – REF_red)/(REF_nir + REF_red) where REF_nir and REF_red are the spectral reflectances measured in the near infrared and red wavebands respectively. As a result, this makes it widely used for ecosystems monitoring.
According to this formula, the density of vegetation (or, in other words, this is NDVI) at a certain point of the image is equal to the difference in the intensities of reflected light in the red and infrared range divided by the sum of these intensities.
In simple words, NDVI as a key remote sensing measurement, describes the difference between visible and near-infrared reflectance of vegetation cover. If you need to calculate NDVI, you will get something between -1 to 1. In other words, its values range from -1 to 1. However, probably, your NDVI will be somewhere between 0-1, which correspond to vegetation areas. Values between zero and below correspond to non-plant surfaces. What is the most important to remember: the higher the NDVI value the greater plants density and better plants’ health. For example, according to Earth Resources and Observation Science (EROS) Center, high NDVI values (approximately 0.6 to 0.9) correspond to dense vegetation such as that found in temperate and tropical forests or crops at their peak growth stage.

NDVI maps – main applications and use
By transforming raw satellite data or drone images into NDVI values, researchers can create images and other products that give a rough measure of vegetation type, amount, and condition on land surfaces around the world.
For many years, the bio-geophysical community widely uses the NDVI. Firstly and most importantly, it helps to monitor the vegetation state and disturbances to address a large range of applications. For example, these factors are important for forestry, agriculture, food security and water management.
Globally, NDVI is especially useful for continental- to global-scale vegetation monitoring. In fact, it can compensate for changing illumination conditions, surface slope, and viewing angle. That said, NDVI does tend to saturate over dense vegetation and is sensitive to underlying soil colour.
NDVI mapping in agriculture
In the last years, NDVI has become one of the most crucial and commonly used indicators in precision agriculture.
Transforming multi-spectral NDVI data into a single image layer allows us to estimate the amount of present vegetation and crop development at the field scale. The most common palette for mapping NDVI is white/green, however, it does not give us a full picture of fields conditions.
Regular work with NDVI mapping of the fields helps to recognise and to mitigate any issues with plant health and vigour, thus, boosting crop yields and making agricultural business more profitable.
Rule of thumb to calculate NDVI pixel values
As we have already said, focus on pixels that fall within the geodetic chain, and you’ll never lose the game. These are the milestones in the pictures and maps. At the same time, it is necessary to focus on the problematic areas. For example, in these areas you will have part of the pixel but not the whole one. Then how to do the calculation pixel NDVI in such cases? There are two important points in the solution of this problem.
Firstly, the main rule – the calculation is only in integer pixels. Though, undoubtedly, the role of the average NDVI pixel values essentially depend on the software. As a result, try to compare different software solutions before you will start your work.
Also, there are some specific moments in the case of mapping large areas. In fact this means that the map projection image affects the result of a calculation as well.
Secondly, the need to focus on the fact that under ideal conditions when calculating a pixel average, the weight of the pixel has to correlate in proportion to the share of its area, which hit the landfill.
In other words, you can get the most accurate results, if you will have ground truth data from the place of your interest. Surely, this is a difficult task if you work far from the location. However, if you can visit the place, then you can get the leaf area measurement for specific place and this will help you to obtain real data. This means that your NDVI mapping will get its real numbers, because you will have real numbers as link to the current situation in the area.