Dark Green Colour Index (DGCI): a new measurement of chlorophyll

Leaf Greenness Index, as a vital component of Petiole Pro, helps to get the measurement of chlorophyll content. How is this possible? Does this index is so helpful as SPAD values? What insights about plants can you get with this this index of greenness? In this article we will try to find the arguments why Dark Green Colour Index (DGCI) may be helpful for you and how to use Leaf Greenness Index in the most efficient manner.
Brief historical overview of DGCI
Dark Green Colour Index or DGCI got scientific approval in 2011 at the University of Arkansas in the USA. The group of four scientists published an article “The Assessment of Leaf Nitrogen in Corn from Digital Images” in the Crop Science journal.
Then in 2012 two groups of crop scientists developed the topic. Almost simultaneously they issued their scientific research works about turf grass and fruits of carambola, mentioning DGCI.
In June 2012 eight plant scientists from China published an article “In vitro selection of glyphosate-tolerant variants from long-term callus cultures of Zoysia matrella [L.] Merr”. Firstly, they explained the meaning of this definition and, secondly, they leveraged the abbreviation “DGCI” for the first time. Then in July 2012, three Malaysian scientists published an article “Visible Spectral Linearisation, Gradient Shift and Normalisation in Quantifying Carambola Acidity”.
Finally, in May 2013 at the University of Arkansas the thesis “Dark Green Colour Index as a Method of Real-time In-season Corn Nitrogen Measurement and Fertilization” was published and explained basics of the index and its application.
What is Dark Green Colour Index (DGCI)?
One of the first definitions of DGCI was:
The Dark Green Color Index (DGCI) is a quantitative measure of greenness that is closely related to leaf N concentration. Abdelaziz Rhezali, University of Arkansas, Fayetteville
However, this paper “Evaluation of Dark Green Color Index Technology as a Method of Real-time In-season Maize Nitrogen Measurement and Fertilization” , has been withdrawn. At the same time, the core idea of the index is expressed clearly.
The other definition says that Dark Green Colour Index (DGCI) is a commonly used algorithm for estimating leaf chlorophyll and Nitrogen.
In fact, DGCI is a value correlated to SPAD values. Hence, it can be considered as a fair and affordable companion tool for chlorophyll content measurement.
At the same time, during the short history the development of research related to dark green colour index was not fast and had clear obstacles.
Problems of Dark Green Colour Index in agriculture
The main issue of using Dark Green Colour Index in agriculture research is caused by… technologies! There is a strong link between available technical equipment and amount of data to get about plants.
In 2012, Dark Green Colour Index (DGCI) was leveraged by the limited number of the scientists who had access to the expensive equipment to get this index. For most of the scientific audience this index was not available because they did not have specific tools which was not affordable for their budgets.
However, the rapid development of mobile phones and smartphones has already solved the problem. As of now, almost every crop scientist have a smartphone and can use it for crop measurement and tracking. As a result, the opportunities, previously opened in front of a limited number of scientists become global trend now. That is why, the number of research works with exploiting Dark Green Colour Index is increasing and available in list of recommended reading to support your understanding of DGCI.
Benefits of using DGCI in agriculture
However, the obvious benefits of using Dark Green Colour Index for agriculture research is its universal nature. On one hand, the crop scientist gets only a digital image of the leaf or other green object. It seems like not so much useful information can be get out of it. But on the other hand, to make work with digital colour data simpler, it is recommended to use a couple of purely technical steps but at the end, this colour in the image will become a number, which is DGCI:
To simplify the interpretation of digital colour data, recent studies have suggested converting RGB values to the more intuitive Hue, Saturation, and Brightness (HSB) colour spectrum, and then into a single measure of dark green colour, the Dark Green Colour Index (DGCI). International Journal of Remote Sensing, 2020
In practise DGCI helps to calculate the amount of Nitrogen fertiliser to cure the Nitrogen deficiency. For example, past scientific researchers determined that DGCI values from maize at V6 to V10 could be used to predict the amount of N fertiliser to recover 90 or 95% of the potential yield.
How to get Dark Green Colour Index (DGCI)?
There are two methods how you can calculate Dark Green Colour Index – indirect and direct.
Indirect Method to get DGCI
You can calculate Dark Green Colour Index with a specific formula. However, to use it you need to know some other parameters of the digital image, like “hue”, “saturation” and “brightness”
Step 1. How and where to get RGB
In your personal computer
This is a simple guide how to get RGB for your image of a leaf or other object. Briefly, you can use any of image editors – MS Paint for Windows, GIMP for Linux or Seashell for Mac. It will help to get the Red, Green and Blue colour indexes for further reference.
Online
Alternatively, you can find any colour picker online and use it in the same manner. As a result, you will get three numbers to bring them to the next step.
At the same time, there is an obvious problem, which is extremely important to remember. Any colour pickers get RGB for only one pixel (1 px) but not the whole picture. This means for a leaf, you need to have millions of RGB points for getting its DGCI. As a result, indirect method is time consuming but not efficient for wide scale plant research.
Step 2. Calculate Hue, Saturation and Brightness (Lightness) for your specific green leaves
Briefly, when speaking about colours using hue, saturation and brightness this is the most convenient way to organise colour differences, which are perceived by human eye. However, on a smartphone screen or a computer monitor any image is made up of varying amounts of Red, Green and Blue (RGB) dots, in terms of concept it is more relevant to discuss colours which are made with hue, saturation and brightness (lightness). The reason for this need is simple: human perception sees colours not in RGB but in different combination of Hue, Saturation and Brightness (Lightness).
The simplest visual explanation why RGB colours are different from the colours perceived by human eyes. For example, if we will pick up the green colour, it has huge amount of particular points to get the colour value.
HUE
Probably, you have seen HUE millions of times. It is a diagram, where any spot is referred as hue. In other words, HUE is a 360-degrees colour wheel to specify the particular tone of colour.
IMPORTANT: HUE is not a colour by itself. HUE does not have saturation and brightness (lightness) but colour has all three components (hue, saturation and brightness).
Saturation
In simple words, saturation is the intensity of a HUE, explained above. In other words, it shows how intensive is HUE. Saturation can be something between grey tone to pure and vivid colour. Grey means no saturation but bright colours mean high saturation.
Brightness (Lightness)
Brightness is the comparative lightness of a particular colour on a black-white scale. Black means no brightness but white stands for full brightness. Brightness is also called Lightness in some contexts, however, its role in calculating dark green colour index stays the same.
You can calculate HUE, Saturation and Brightness (Lightness) with a formula or automatic online tools.
Calculate HUE, Saturation and Brightness (Lightness) with a formula
Convert the RGB values to the range 0-1. You can do this by dividing the value by 255 for 8-bit colour depth (R, G and B – are given values): R = r / 255; G = g / 255; B = b / 255 Find the minimum and maximum values of R, G and B. Depending on what RGB colour channel is the max value. The three different formulas are: If Red is max, then Hue = (G-B)/(max-min) Otherwise, if Green is max, then Hue = 2.0 + (B-R)/(max-min) Then if Blue is max, then Hue = 4.0 + (R-G)/(max-min)
You need to multiple the HUE value by 60 to convert it to degrees on the colour circle. If HUE becomes negative you need to add 360. Indeed, there is a deep mathematics behind this step but we won’t explain it here in details. You can calculate the Brightness (Lightness) value by adding the max and min values and divide by 2. To get Saturation, you need to consider the value of Brightness (Lightness). If it is less or equal to 0.5, then Saturation = (max-min)/(max+min). However, if Luminance is bigger then 0.5. then Saturation = ( max-min)/(2.0-max-min)
Get HUE, Saturation and Brightness (Lightness) with online tool
Other way to get these values is to use online tools. They do calculations automatically. For example, you can use this W3Schools Tool or instrument at RapidTables. Step 3. Utilise the formula for DGCI
As we have already mentioned:
DGCI = {(hue − 60)/60 + (1 − saturation) + (1 − brightness)}/3
Case Study How to calculate Dark Green Colour Index using indirect method
For example, we can calculate the DGCI of the green square below. We take this square with the same colour to show you how the calculation work. It’s a rare case, if you have a leaf with so smooth colour. At the same time, for learning the basic principle, we need something clear and available to check.
We can see the printed numbers of Red, Green and Blue colours there. However, to double check, we can open this picture in our image editor.
In the picture below you can see these values. They are the same as printed on the green card and are the following:
Red (R) = 97 Green (G) = 138 Blue (B) = 61
Then we need to get HUE, Saturation and Brightness of this specific object.
We use both online tools for this and get our values:
It is always a good idea to double check the results of an intermediate steps of Dark Green Colour Index calculations. Screenshot from W3School
Hue (H) = 92 Saturation = 38.7% Brightness = 39%
Finally, we can put the variables into the formula of Dark Green Colour Index and calculate its value for the selected green object. It is important to use Saturation and Brightness (Lightness) not in percents. For example, in our case it will be 0.387 and 0.39 respectively.
DGCI = {(92 − 60)/60 + (1 − 0.387) + (1 − 0.39)}/3 = (0.533 + 0.774 + 0.61) / 3 = 0.639
Direct Method to receive Dark Green Colour Index
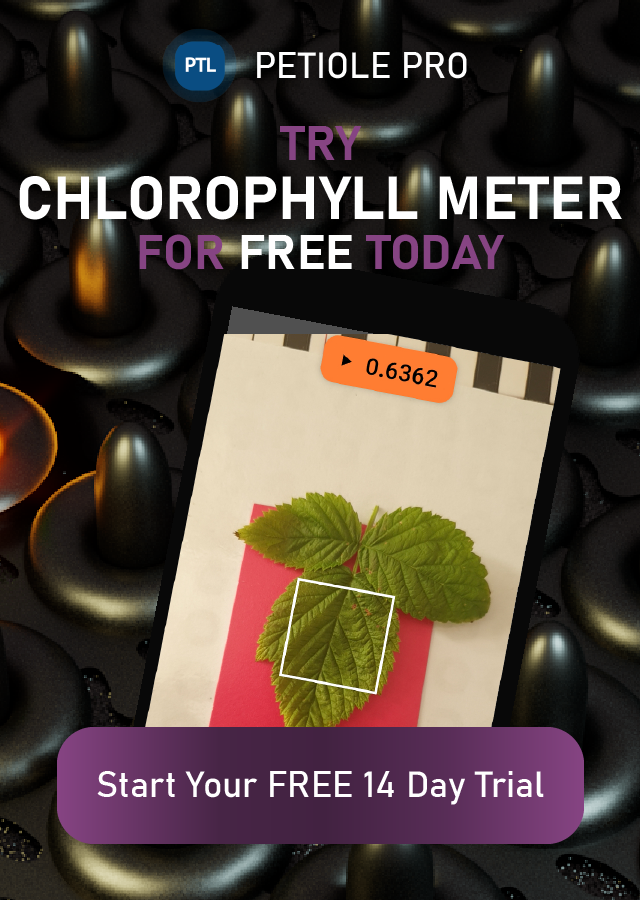
This method includes using external appliances to get DGCI immediately. One of the most popular tool for obtaining greenness index instantly is a smartphone and a mobile application.
You can get the Dark Green Colour Index with your smartphone. You do not need any other equipment. Just download a mobile application, provide permissions to use your camera and file storage and launch the mobile application.
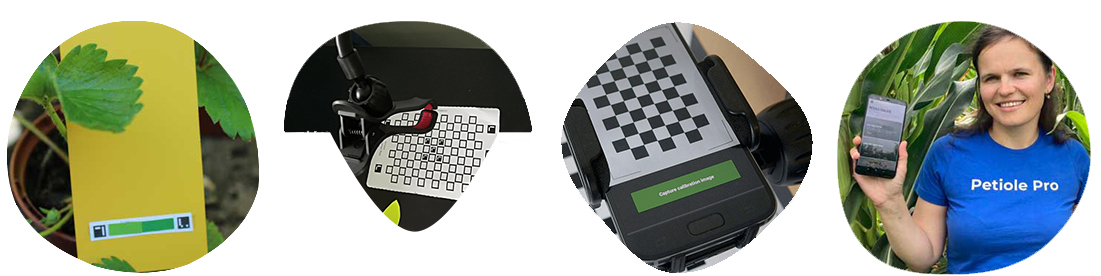
Step 1. Calibrate camera for colour measurement
For successful calculation of Dark Green Colour Index you need to calibrate camera. Without this step your camera simply cannot “read” the colour properly and will use basic settings. They are not relevant to your specific environment. However, with camera calibration, your smartphone can adapt its features to your surrounding environment on the moment of measurement.
Turn on QA Mode
It is crucially important to activate so called QA Mode for camera calibration. This regime of work helps to focus your camera work on finding a colour calibration pad to get the foundation for future greenness measurement.
Use a Colour Calibrating Pad
Colour calibration is not the same as calibration for leaf area meter. Colour calibration pad is not a simple piece of paper with green and yellow or pink colours. Also, as you can see, it has special markers. Markers are the information, which is written in the language of your smartphone’s camera. In other words, markers are the starting point for camera calibration and they say: “Camera, you are doing great job! Now use these colours”.
When your camera sees these markers it starts to see the colours more accurately. In relation to Petiole Pro, you can buy the colour calibration pad by ordering it. You need to use the mobile application and press the button “Request a pad” in a Leaf Greenness Index module.
Step 2 – Calculate Dark Green Colour Index instantly
Finally, if you have already had your colour calibration pad in front of your camera, you need to continue.
IMPORTANT: your colour calibration pad must be in the area, visually captured by your camera. It is allowed to have it somewhere near the white square “measuring area”. However, it must be visible. Petiole Pro Knowledge Base
Some of our customers ask about the impact of height or light on the measurement of DGCI. You should not care either about light or height. With colour calibrating pad, Leaf Greenness Index gives you the most accurate value of the colour without impact of sunlight or close distance to the object.
Step 3 – Save the colour measurement
You can save the chlorophyll content measurement pressing the central button of the Petiole Pro application. Then at the end of the session you can access any of your measurements as well as see some basic analytics. For example, you can get the number of measurements and automatically calculated average DGCI for the session. This means if you had measured three leaves and got greenness indices 0.5432, 0.6543 and 0.7654 then average DGCI for the session will be (0.5432 + 0.6543 + 0.7654) / 3 = 0.6543. However, with a dozen or 50 leaves, this equation will be more time consuming. At the same time, your smartphone does this work for you immediately.
Step 4 – Share your colour measurements
Indeed, one of the biggest headaches is not just to collect data but to share it with colleagues. This is the problem of many pieces of scientific equipment, when you can get measurement but then need to write it somewhere for further work. With mobile application, this is not a problem at all and you can share reports about any session with leaf greenness data with any convenient tool starting from email and finishing with Slack, Google Drive, Skype, WhatsApp (or even Facebook Messenger). Or, even you can send it to your wireless printer! However, please, be cautious and care about paper and trees.
Also, you can watch the video tutorial covering each step to measure Dark Green Colour Index with a smartphone:
source: youtube
Conclusions
We believe that this brief article will help you to understand the huge potential of Dark Green Colour Index as a powerful numerical representation of the amount of chlorophyll in a leaf. Please, leave us a comment if you have any questions or ideas. And good luck with your measurements of green colour in a leaf.
List of Recommended Reading about Dark Green Colour Index in Agriculture
- Spectroscopic measurements and imaging of soil colour for field scale estimation of soil organic carbon, Geoderma (2020)
- Mathematical models for the estimation of leaf chlorophyll content based on RGB colours of contact imaging with smartphones: A pomegranate example, Folia Horticulturae (2020)
- Paclobutrazol and phenoxaprope-P-ethyl potential as growth regulator in Carpet grass Plus, Ornamental Horticulture (2020)
- Sewage sludge composted in the coloring and development of Bermuda grass, Ornamental Horticulture (2020)
- Normalized Difference Vegetation Index versus Dark Green Colour Index to estimate nitrogen status on bermudagrass hybrid and tall fescue, International Journal of Remote Sensing (2019)
- Influence of aerification technique on recuperative potential of warm season turfgrasses, Indian Journal for Agricultural Science (2018)
- Novel approach for estimating Nitrogen content in paddy fields using low altitude remote sensing system, The International Archives of the Photogrammetry, Remote Sensing and Spatial Information Sciences (2016)
- Development of an android app to estimate chlorophyll content of corn leaves based on contact imaging, Computers and Electronics in Agriculture(2015)
- Evaluation of leaf chlorophyll content by a non-invasive approach, International Journal of Innovative Research in Electrical, Electronics, Instrumentation and Control Engineering (2015)
- Quantification of rice canopy nitrogen balance index with digital imagery from unmanned aerial vehicle, Remote Sensing Letters (2015)
- Assessment of rice leaf chlorophyll content using visible bands at different growth stages at both the leaf and canopy scale, International Journal of Applied Earth Observation and Geoinformation (2014)
- An Algorithm Based on the RGB Colour Model to Estimate Plant Chlorophyll and Nitrogen Contents, International Conference on Sustainable Environment and Agriculture (2012)
- Visible Spectral Linearisation, Gradient Shift and Normalisation in Quantifying Carambola Acidity, Food Biophysics (2012)
- The Assessment of Leaf Nitrogen in Corn from Digital Images, Crop Science (2011)