How to identify Nitrogen Deficiency without SPAD

Nitrogen deficiency is one of the most common plant disorders. It affects mostly green plants and manifests itself in a light yellowish-green leaf colour, followed by pale or white stems. If you are an avid grower who would like to have healthy plants, then it’s important for you to know how to identify Nitrogen Deficiency without SPAD (soil plant analysis development). Here we will discuss what it means and why we need to monitor changes in the amount of chlorophyll.
What is Nitrogen deficiency?
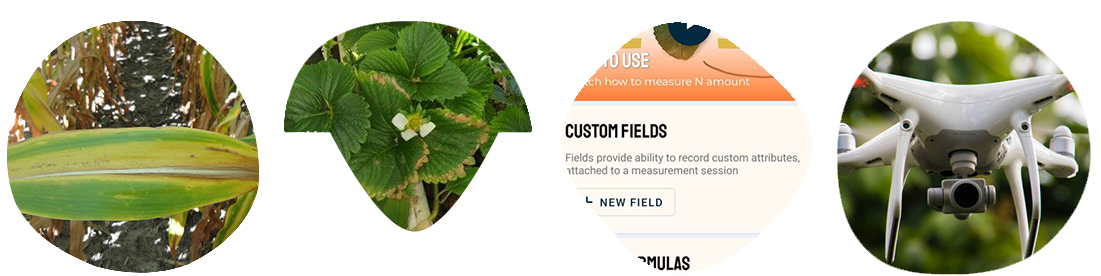
Nitrogen deficiency is always an imbalance, which can be caused by incorrect feeding. Otherwise, the amount of feeding could be appropriate but it may contain insufficient nutrient elements. Nitrogen deficiency on corn leavesCorn leaves with nitrogen deficiency. Since N is an essential nutrient, its depletion can lead to severe yield loss
The problem of this type of deficiency is related the decrease of photosynthesis more than deficiencies of other macronutrients. In other words, phosphorus deficiency or deficiency of magnesium in plants are not so impactful on photosynthesis as the N deficiency.
Symptoms of Nitrogen Deficiency in Plants
The visual symptoms of N deficiency are relatively easy to spot on in some crops. Deficiency of nitrogen causes dramatic reductions in growth and a plant cannot make the proteins for own development.
With N deficiency the foliage changes colour. It becomes yellowish-green (or chlorotic). Traditionally, the symptoms start from the older leaves because nitrogen is a mobile nutrient in the plant,. However, after some time the whole plant becomes the same colour, as conditions become acute.
Specifically for corn, the younger plants with nitrogen deficiency may be stunted and spindly. As usual, this is with yellowish-green or light-green colour. On older plants it is possible to see the traditional V-shaped yellowing on older leaves. It usually starts at the leaf tip and progresses down the midrib.
As a result N deficiency can lead to severe yield loss.
How to Identify Nitrogen deficiency in plants?
There are two basic methods how to identify nitrogen deficiency in plants: visual and technical.
Visual assessment of plants and symptoms is an affordable and cheap method. Any farmer or grower can use it. However, in most cases, the appearance of visual symptoms is caused by severe and progressive disorder. Hence, the negative impact of N deficiency will have place.
For early stage determination, there is a need to use technical equipment. In past, crop scientists use only handheld chlorophyll meters due to lack of any alternative. The most popular solution for this task was SPAD.
This soil plant analysis development can measures chlorophyll in real time. However, the main disadvantage of any device in this product range is its price. SPADS are extremely expensive and not affordable for 90% of scientists worldwide.
However, digital technologies bring positive changes in this field and now it is possible to identify nitrogen deficiency in plants with a smartphone.
How to check N in plant leaf with a smartphone?
A smartphone, which is, in fact, a personal mini-computer, it is not clear how to recognise a plant and what is the difference between, for example, a plant leaf and a flower.
That’s why, smartphones must have special instructions for these types of tasks. Traditionally, they are hardly read by human but this set of instructions helps to identify the colour of a leaf. It returns the value as Dark Green Colour Index (DGCI). On one hand, it sounds too technical and you may have a question: how this DGCI can help me with identifying the chlorophyll in a plant leaf? On the other hand, the answer is quite straightforward.
Due to existing correlation between DGCI and SPAD measurements, it is possible to calculate SPAD values even without a real hand-held device. This possibility is extremely helpful to scale up measurements and make them more affordable for more plant scientists.
What is the relationship of DGCI and SPAD values in corn?
There are two news. The bad news is that linear regression coefficients differ because of type of crop, stage of grows, location, etc. The good news is that there are numerous researches on this topic, particularly, for crops like corn, rice, wheat. Hence, it is possible to use them in your own needs. Finally, if your educational institution is so lucky to have a real SPAD, then you can double-check the values and follow your results in further measurements.
For example, returning back to the article about the relationship of DGCI and SPAD values to corn grain yield in the Eastern Corn Belt, we can consider an approximate order of steps how to get the value for chlorophyll measurement.
Instruction how to get SPAD values with a smartphone
- Launch a mobile application and choose Leaf Colour Chat
- Choose Custom Fields and tap New Field
- In a new window New Custom Field write Name as value (or you can choose any other name).
- Important: you must remember this name for other steps!
- In Description for this field write value of measurement with camera. Then press Submit.
- Scroll screen to Custom Formulas and tap New Formula
- In a new window New Custom Formula write the Name of the formula. Let’s call it spad_v4.
- In Description write SPAD value for V4 or any other relevant explanations.
- For Expression write 0.176*value+0.599, where 0.176 is a slope but 0.599 is an intercept, which we take from the Table 2 “Linear regression analysis relating relative dark green color index (DGCI) to relative soil plant analysis development (SPAD) at V4, V6, and R1 to R2, and relative DCGI or relative SPAD to relative earleaf N concentration at R1 to R2 for individual site-years and across locations” in this article.
- In other words, for you these values of a slope and intercept would be different. However, the expression of linear regression must be always as it is a+bx, where a is an intercept, b is a slope, x is a DGCI (or value as we call it in our example). And as a result you will get the SPAD value or spad_v4 as we call it now.
- After you put an expression to the relevant field, press Submit
- After creating your own custom formula of SPAD values, you can start measurement. Tap the orange button Measure at the bottom of your screen.
- Place a leaf in front of the camera and get the measurement of DGCI in orange field on the top of the screen. Tap on this measurement and see the spad_v4 value. Save it for further reference and measure as many leaves as you need.
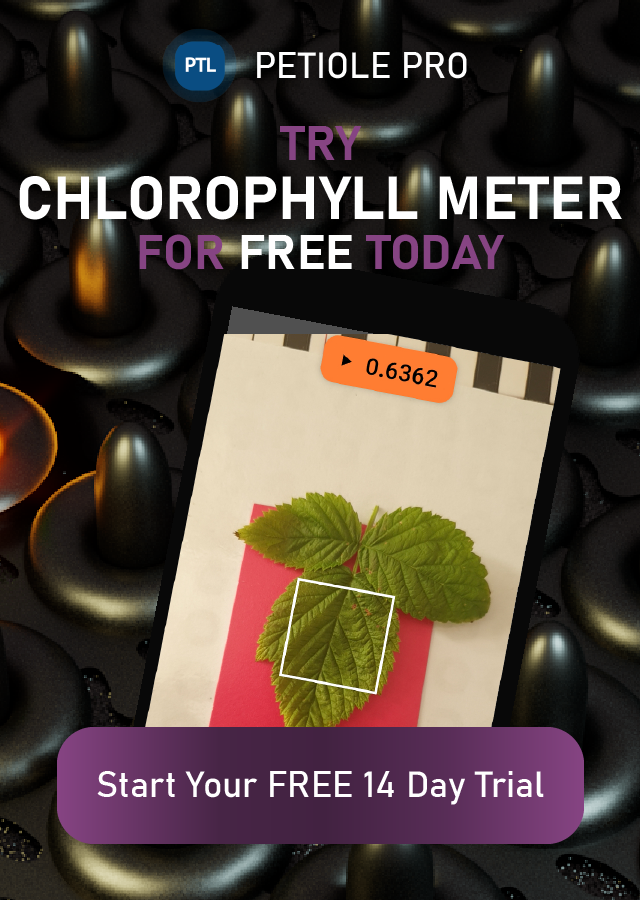
It is possible to get the SPAD units of leaf greenness without this device but using a camera of a smartphone with Petiole ProIt is possible to get the SPAD units of leaf greenness without this device but using a camera of a smartphone
Are these measurements of SPAD values of chlorophyll with a mobile phone accurate?
There is 98% accuracy for leaf area measurement. However, for chlorophyll content meter it is better to use the term “approximately accurate”. The existing first version of this meter includes the basic algorithm of computer vision to calculate dark green colour index.
Acknowledgments
In this article we use photo materials from the following web resources:
- Ohio Counry Journal
- University of Minnesota Extension
- Components of soybean resistance to the soybean aphid, Aphis glycines Matsumura, on Researchgate